

Rookie Corner : Technical Tango XI
January 31, 2018

Last week we talked about moving averages and how they can help confirm our expectation of where an equity price might be headed. On this journey through trading, we have gone through how to set goals, how to find good stocks to trade and how to read a chart to give us an edge when we are looking to trade. In the technical part, we have seen that we can use common and important psychological price points called support and resistance to help us determine where on a price chart there might be an opportunity to react to a specific event. As discussed that event could be a reversal or a breakout or the formation of any one of the patterns or sub-patterns that we have discussed in this blog. We have talked about how we can see things while they are happening that can add to our edge in our trading. The example is watching the volume, which is essentially a picture of the buying and selling for any particular timeframe, for hints that momentum might be slowing or increasing or telling us that whichever direction the stock is currently in could continue unabated. All of these items can help us in determining higher probability trade setups and give us a chance to catch a winning trade.
All of the tools mentioned above have to do with the price action of a particular stock and this is how we approach every trade. We look at price action first and everything else after! Why do I say this? I say this because it is human nature to think that some system or tool can be designed or created that can tell us with absolute certainty that a stock will go one way or another. Many people have tried to invent a way to beat the market and all have missed the mark. Some people have created tools that certainly help in navigating the treacherous waters known as the stock market. For example, John Bollinger, who invented the Bollinger Bands, a system based on standard deviations and moving averages is the first to say that his system is not a stand-alone system and that he recommends using two or three un-correlated indicators in conjunction with his to better the chances to be successful.
In addition to the inventors of these systems, we have the forefathers of technical analysis and they all say that it is price action first and everything else after. There was a very successful stock forecaster named Edson Gould. Edson Gould has the longest, most accurate record of calling price movements of anyone on record to my knowledge. He was able to accurately forecast prices from the 1930’s right up until his passing in the 1980’s. By the record, he did all the accurate forecasting by doing three things, reading the charts, understanding market psychology and using one indicator. Edson was affectionately termed the Wizard because his prowess in price forecasting was very astute. So instead of re-inventing the wheel, we can piggyback off his and his peer’s success by following their process. That process is to follow the trends, read the charts, and understand the psychology of the markets and then add in indicators as required, always remembering that indicators are not a crystal ball for price forecasting.
Now that we understand the role of an indicator we can proceed to adapt them to our trading setups. When we are setting up our trades we want to put as many things in our favor as possible so we look at several different items on each trade before deciding whether or not this trade favors us. We talked about what we need when we are looking at let’s say a bullish retracement. We need the following items and they are in order of importance. For the bull retracement, we are looking for an uptrend, increasing trend momentum, an orderly pullback, a slowing momentum in the pullback, we need a technical event to signal us that a turn around is possible, this is where we can get a candle or a signal from an indicator to alert us or confirm that a reversal is possible, and finally we need to see the volume participating. This set of criteria has been termed scoring the chart. We can see that where indicators come into play is quite a ways down the list of whats important but we are happy to add it to the list so that it gives us a better chance at a successful trade.
So let’s delve into this weeks indicator. Last week we looked at the moving averages and discussed how we can use them to see what is happening in a particular stock like whether it is bullish or bearish. Also, we can use the moving averages to confirm that trend changes are in the works. The moving average crossover tells us that a trend could be changing although this is a lagging indicator and the trend is already changed when we actually see the cross but this is still a good way to confirm the change. This week we are going to use the moving averages in a little different manner to give us an indication that the momentum of a trend may be changing before it actually changes.
The indicator called the MACD uses a couple of different moving averages plotted along a chart to signal that the momentum of whatever we are watching could be changing. The MACD uses the 26 day EMA (Exponential Moving Average) and subtracts the 12 day EMA and then plots this line along the x-axis of a graph. This line is not static and is plotted as the data is received. This line looks just like an MA on a price chart but has a notable exception. This calculated value is plotted against the 9 day EMA which is a reference line and in this indicator it is called the signal line. The significance of the MACD is that when the MACD line crosses over the signal line then it generates a buy or sell signal depending on the direction of the MACD line. If the MACD line is moving up across the signal line then that is a bullish signal or buy signal and vice versa in the other direction. This is only to confirm that something is bearish or bullish. We need to understand that something is bullish or bearish from the candlestick formation, called price action, and not waiting for this indicator to tell us but this is a nice addition to confirm our understanding. The other and in my opinion far more important part of the MACD indicator is the divergence portion of the indicator. Divergence is a fancy term to say that two things are going in opposite directions. This divergence can tell us if a trend change is possible in the near future, it can give us an indication that the stock is losing momentum. Take a look at the charts below and you will see I have highlighted the signals and the divergence that I am referring to above.
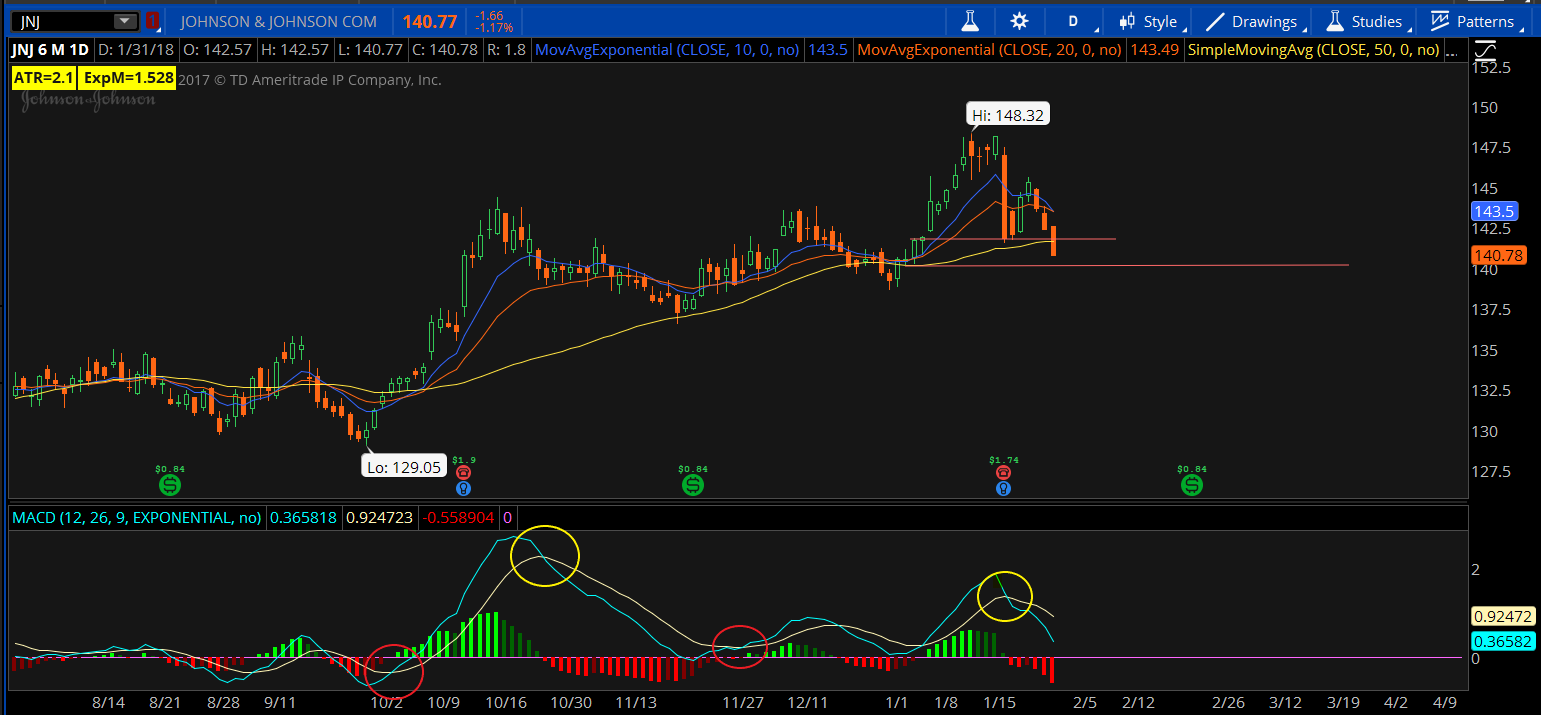
You can see in the above chart the bearish crossovers in yellow and the bullish crossovers in red. This confirms what we can see on the price chart. The price chart turns first and then the MACD signals that turn with the crossover. You can see the lag here but some folks use this to confirm their opinions about price action and that has some value to some folks but I think the next chart will show the real power of the MACD.
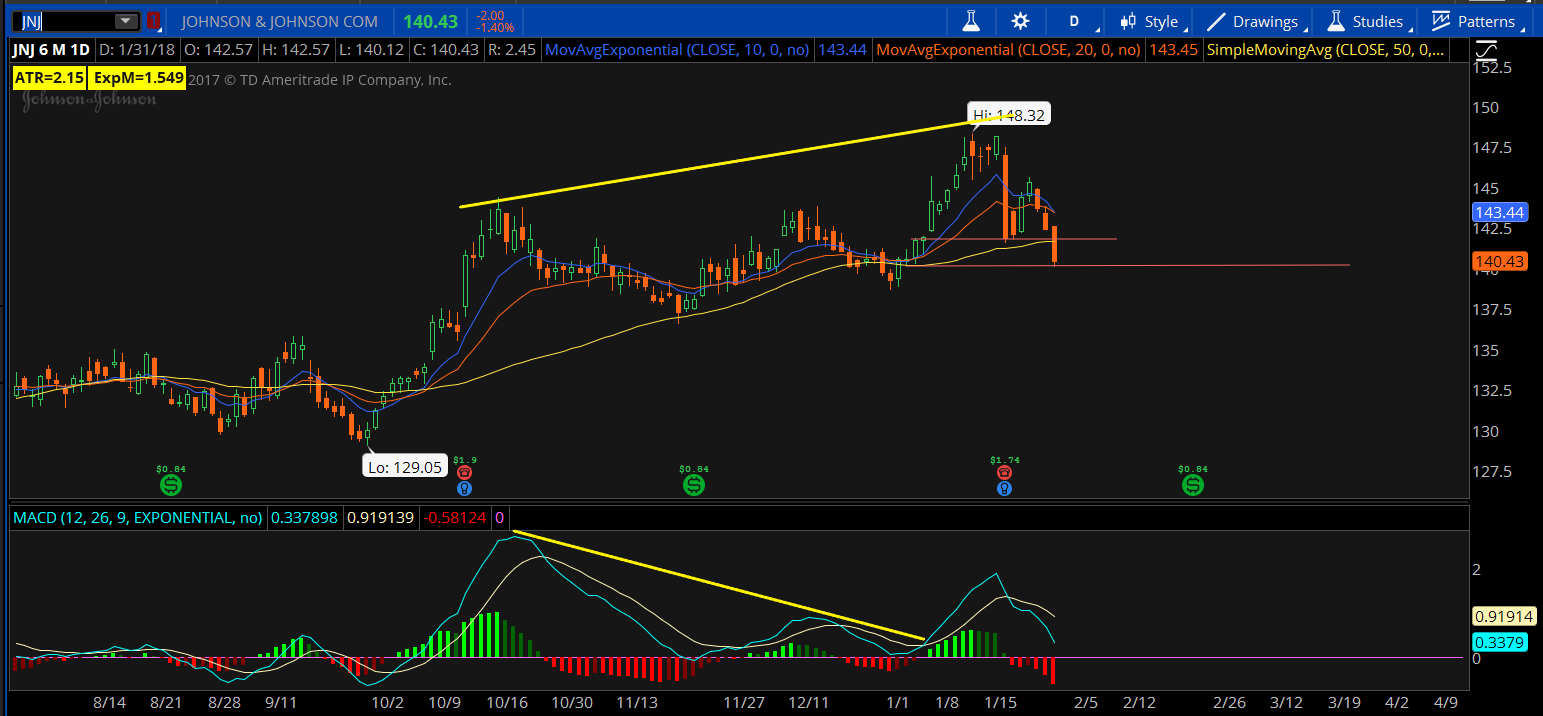
If you look at this chart you will see that even though the price pivots (see the top yellow line) of this stock were going up that the peaks of the MACD (see the bottom yellow line) were going down and this is the classic definition of bearish MACD divergence. You can also see that this divergence front runs the current drop in this stock.
When we recognize this divergence in advance we can prepare ourselves for any potential change that may come at us. This is the real power of the MACD, the ability to get a head’s up about something that can affect our equities.
So in summary for the MACD, we can get both signals and divergence from the MACD and then use this in conjunction with our price action to put ourselves in the best position to have a winning trade. I know that when some traders see how this indicator works that they will try to use it on its own to predict price movements and that would be a mistake as I said at the start of this blog these indicators can be valuable but only in addition to our price work.
Next week, are going to jump into another momentum indicator called the Relative Strength Index (RSI). This indicator has its own subtle nuances and we will explore that to give us yet another choice in indicators that we can use to confirm our price action. Check out the MACD and see if it has value for you and if not we got a few more that may be more to your liking.

Lovely…MACD!