

Rookie Corner : Technical Tango XII
February 7, 2018
Wow! What a game! Of course, I am talking about Super Bowl LII that was held on Sunday. That was a great football game for anyone who enjoys watching sports. There were a couple of lead changes during the game and there was a lot of back and forth action. Ultimately, in the end, there was a winner and a loser in that game. This reminds me a lot of trading and specifically price charts. There are always lots of ups and downs in the price chart and there is always a winner and a loser in the trade as well. Now, what I find most fascinating is the game within the game, specifically the adjustments that were made by both teams in real-time on the field. The offensive and defensive coordinators were forever adjusting their schemes trying to outdo each other. The part that is fascinating is that each coach had subtle clues about what the other team was doing but needed to see the action on the field to be sure that those subtle clues were actually what they thought they should be. These subtle clues are akin to the indicators that we use on our stock charts. They can be used to help figure out what might happen next but it is really the price action that gives us the go-ahead to trade.
Last week we talked about the second of a few indicators that we are going to explore. We went through the in’s and out’s of the MACD indicator. We talked about how the MACD can show us two different kinds of information and what that information can do for us. The MACD shows buy and sell signals when the different moving averages crossover one another. Last week we discussed how these signals lag the actual price movement and that we only use this part of this indicator to confirm what we see in the price chart. The other part of the MACD that I believe is infinitely more important and more usable is the “DIVERGENCE” part of the indicator. The MACD actually stands for Moving Average Convergence Divergence. It is this divergence part that can provide us with a hint at what might be coming at us instead of just confirming what we are already seeing. In the MACD we can see that when the peaks of the MACD are moving one way and the stock pivots are moving in the opposite direction that this divergence can signal a possible trend change before it happens. It doesn’t provide a foolproof signal that the trend is going to change but it does wave a flag and says “hey look at me?!” It is this front-running that can be invaluable to our trading.
This week we are looking another indicator namely the RSI. The RSI or “relative strength index” is a momentum indicator similar to the MACD. Also, like the MACD, the RSI can give us two types of information. The RSI can give us overbought and oversold conditions and can give us divergence as well. The overbought and oversold conditions are used by some traders as confirmation of a trend change just like the MACD. This is a lagging indicator and its use is up to the individual that is using it as to what value they place on that information. There is a problem with the RSI just like other indicators. That problem is that traders tend to use the information for trading signals and this can be problematic. Here is the reason why this can be problematic, just because something is overbought or oversold doesn’t mean it has to reverse course at the moment that it goes into one of those two conditions. The reality is that the market can stay overbought or oversold longer than anyone can expect and if a trader doesn’t use all around good technical analysis and instead relies on an indicator or several indicators then it typically ends up bad for that trader. I am sure by now if you are reading this blog post or last weeks you can tell that I am very careful about using indicators. It is because I understand that all indicators are fallible to a degree and I understand the tendency of new traders to want to find that one thing that will give them winning trades all the time. This holy grail of trading does not exist, myself and countless others have spent a great deal of time, energy and money looking for that very thing and to the best of my knowledge and the knowledge of those who are much smarter than myself, it doesn’t exist. I tell you this so as to save you time, energy and money and hopefully, you can come to the realization that there is no perfect trading system or indicator and that is why we need to practice good money management skills in our trading and that will keep us in the trading game for a long time. Having said that there is a place for indicators and as long as we use them appropriately then they can assist with our trading.
As stated above the RSI can give us signals when things are overbought and oversold but the more important part of the RSI indicator, in my estimation, is the ability to indicate divergence just like the MACD. This is helpful because it can give us information in advance of a change as opposed to just confirming an event. This advanced notice is only good if we can recognize the event as it is happening. The way it works with the RSI is that if the price of a stock makes a new high but the RSI doesn’t make a new high as well then it is considered bearish divergence. This can be seen much like the MACD by looking at the peaks of both price and the RSI. See the image below to understand the concept.
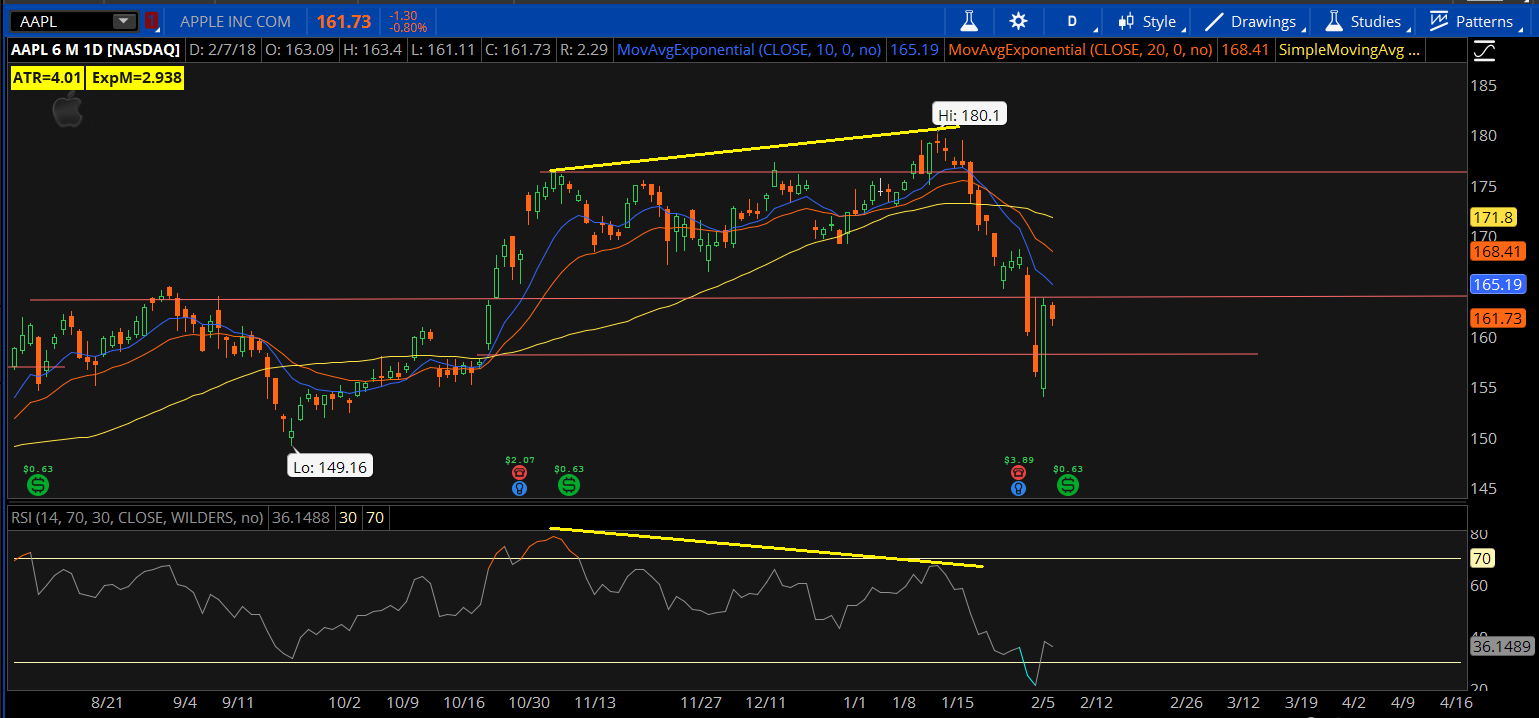
You can see from the yellow lines that even though the price is headed higher and making a new high that the RSI indicator is not making a new high and this is classic bearish RSI divergence. If we are able to recognize these patterns setting up in advance then this can help us get ready for a change in the stock or equity. We never trade on this alone as it is not enough to do so but we can confirm this as soon as the price action begins to fall and this gives us an idea that the fall may have some conviction to the drop as is the case here in AAPL. The reverse is also true when the price makes a new low but the RSI does not then we have a bullish divergence and we could expect that a reversal could be in the works. Take a look at the example below for an example of bullish RSI divergence.
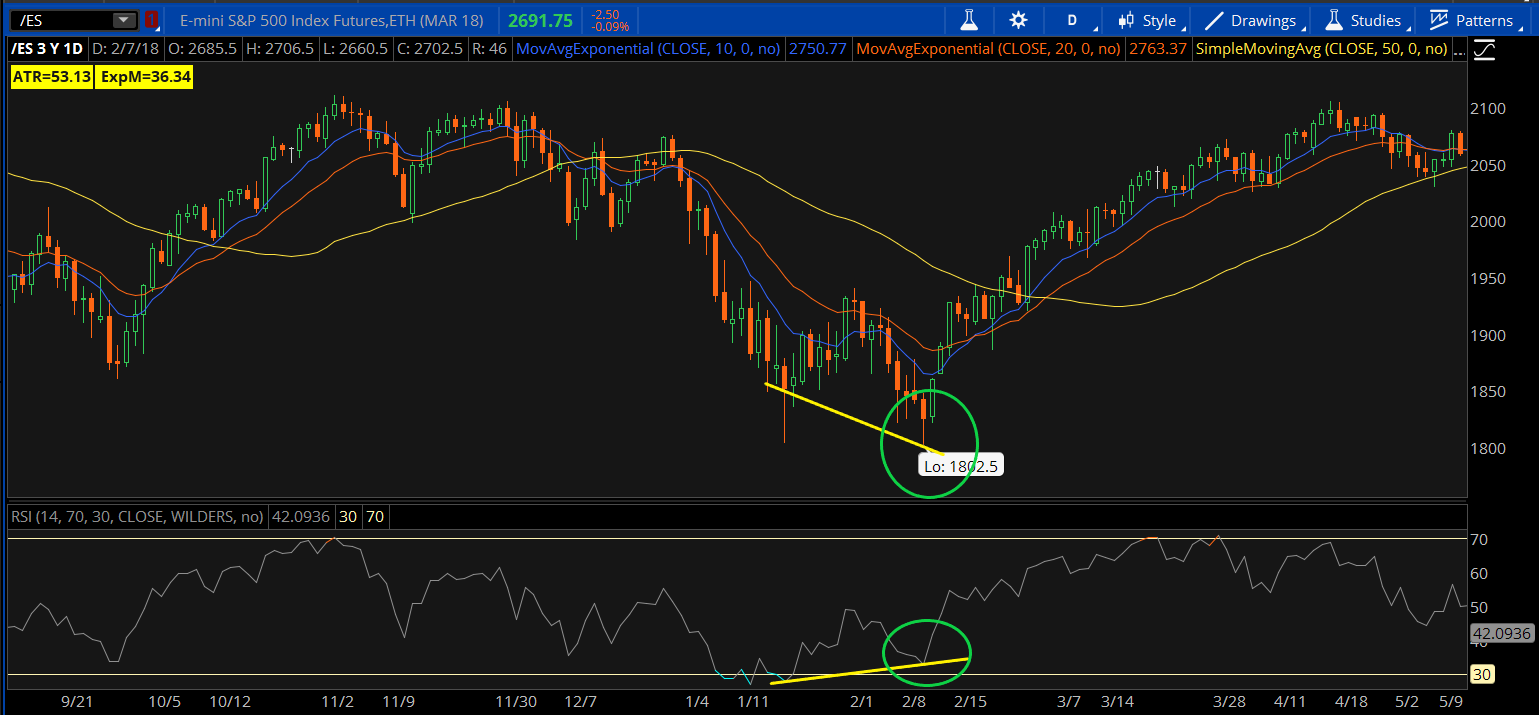
You can see from the yellow lines that are moving in opposite directions that indicates divergence. I have circled the lower price in the stock with a green circle and the higher RSI with a green circle so it is easier to spot. We can see that shortly after this occurred the stock price reversed and moved higher. We can use this information in addition to great chart reading to give us an edge in our trading.
We have gone over a couple of momentum indicators and we will continue on next week when we discuss a different type of indicator, namely the Bollinger Bands. This indicator uses the standard deviation concept and we will discuss how to use it and when to use it to see if we can get an edge on our trading with it.
Try out the RSI and see if it has value for you. All these tools are great in their own way we just have to make sure that we wield this power properly and use it in the right context. Throw the RSI on your charts and see if you can identify the divergence and then you can get ready for when the reversal comes along.

this is going to be a game changer for me! Gone back through a few charts now and can clearly see the RSI divergence preceeding a change in direction of the underlying, can’t wait to see how this plays out in real time. Thanks for the tip!
Hi Rob,
I am glad you are finding this useful, just please remember my warning from the blog, we trade this in addition to the price action and not by itself, just because the nature of all indicators is that they are fallible at some point and so we need to use indicators as a source of secondary information, price and time are our primary trading drivers.
Happy Trading
For sure, I will do some back testing and paper trading with this to get a feel for it.
Awesome!! That’s what smart traders do! Test everything to see how it fits, this will save you and make you money over time,