

Rookie Corner : Technical Tango XIV
February 21, 2018
It seems like the market has spoken! After six consecutive days of positive trade, we are pushing back up towards the highs again. So does this mean the pain that we experienced a couple of weeks ago is over? Maybe yes, maybe no? No one really knows what will happen but we can still set ourselves us to prosper regardless of what happens in the markets. We are sitting at a known resistance level and this could be the turning point or maybe it is the next spot for a breakout. The way we prosper no matter what happens is by increasing our financial intelligence and that’s what this blog is all about. So this week we are going to continue our education by exploring the next in our series of indicators.
The next indicator we will delve into is the Bollinger Bands. Before we get into the Bands, I want to elaborate on the statement I made above. Some of you might be wondering what I was talking about when I said we could prosper regardless of where the market goes? Do you believe that is possible? Is there a way that we could set ourselves to take advantage of the move whether it breaks out or reverses? The answer is yes! We could set up a trade that triggers if we get to a higher level, anything beyond this current level of resistance, and we could set up a second trade simultaneously to trigger if the price starts to fall and we can have it so that if the first trade triggers the second trade cancels. How cool is that? That concept is called the K trade. The K trade is something we will talk about when we get to entries and exits portion of this blog. For now, just know that we can win even when we don’t which way the market is going as long as we set our trades up in advance. We have to plan these trades in advance and that is a skill we are going to perfect as we move towards our first live trade!
Ok, let’s get back to our indicator discussion. We have discussed two indicators that give us buy and sell confirmations and can show us divergence before the price turns to assist in our analysis of the price action. This weeks indicator works a little differently. This weeks indicator is a measure of volatility. The Bollinger Bands uses standard deviations to plot lines along a chart with a moving average in the middle. This moving average is considered the mean and this indicator uses the theory that everything eventually reverts to the mean at some point. Below is a picture of the bell shape curve that represents volatility. Prices tend to stay in a range and when volatility expands then these prices can reach out beyond the standard deviations. This bell-shaped curve shows the percentages of a move beyond a standard move.
You can see from the above picture that a 3 standard deviation move has a very small chance of occurring. The question is why do we care about this as traders? Well, equity price movements fall into the picture of this bell-shaped curve as well and this is how the Bollinger Bands can show us when prices are moving beyond normal ranges and this can give us potential buy and sell signals. If you look at the chart of AAPL below you can see that the price of the equity moves outside of the bands very infrequently and doesn’t typically stay outside those ranges for very long.
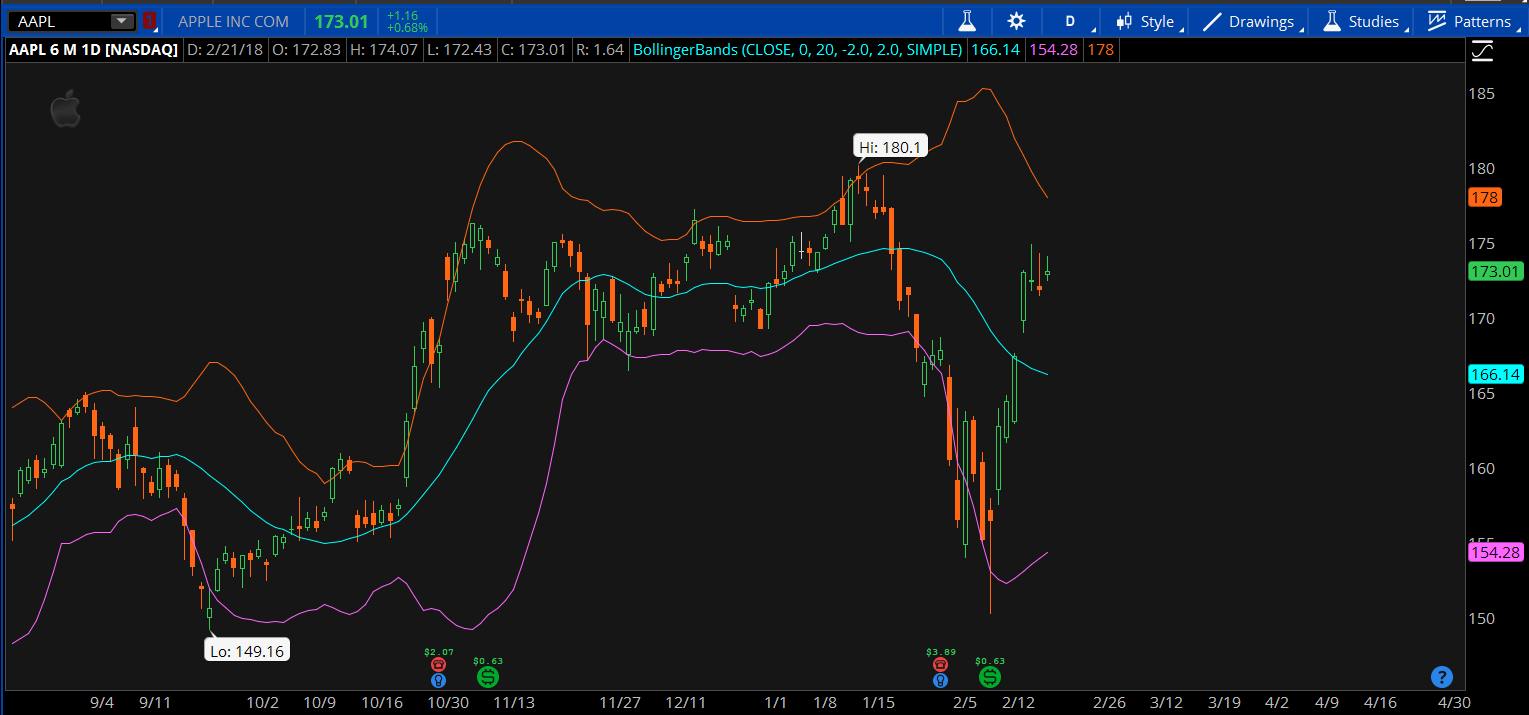
The upper band, in red, represents one standard deviation above and the lower band, in purple, represents one standard deviation below the exponential moving average in the middle. You can see that sometimes price gets beyond these limits and usually reverses at some point. This information is somewhat limited as the price can stay outside the standard deviation for some time before reverting to the mean. The other part about the Bollinger bands is the narrowing and expanding of the bands. This is a direct correlation to the volatility. If the band narrows then that represents the shrinking of volatility and vice versa with the expanding of the bands. So this leaves us with the question, what do we do with this information? Some folks use these breakout of the bands as signals to buy and sell. This can be useful but only if we use this in conjunction with other information such as price action and volume. Even, John Bollinger, himself did not use this indicator alone. He had 22 rules that he followed with this indicator to make it useful. Here is rule number 6 from John, himself. 6. Tags of the bands are just that, tags not signals. A tag of the upper
Bollinger Band is NOT in-and-of-itself a sell signal. A tag of the lower Bollinger Band is NOT in-and-of-itself a buy signal. There are 21 other rules that you can check out if this indicator interests you. For now, we just need to understand that this can assist us in trading but is not a fail-safe system.
If you use the Bollinger Bands in conjunction with spikes in volume and price action then there can be some merit to the buy and sell signals that we see. I know a lot of people will be tempted to use the Bollinger Bands by themselves because looking at the chart you can see that every time the price gets outside the bands it reverses at some point, doing this will result in trading heartache. We need to remember that indicators just help they are not a substitute for good chart reading.
So, in summary, we can get buy and sell signals from the Bollinger Bands and we can get a picture of increasing or decreasing volatility. Just remember to use this with the price action and this may be a tool you want to add to your trading. Add the Bollinger Bands to your charts and watch the volume on your charts to see if you can find a correlation between the two. If you can find a repeatable pattern using the Bollinger Bands, volume and price action then you may be able to use it in your trading.
Next week we will look at one more indicator. We will look at the On-balance volume indicator to see if we can extract some value and knowledge from that indicator. Remember to practice with the Bollinger Bands to see if they fit with your trading style.
