

Rookie Corner : Technical Tango X
January 24, 2018

We are inching ever closer to owning the knowledge we need to produce our first trade, so let’s keep going…
Last week we did a review of all that we have covered so far in our examination of the technical analysis world. We also brought volume into our arena and discovered how we can use that to our advantage. This time around we are going to delve into some other parts of technical analysis that can help us enhance the information that we get from the basics of technical analysis. Those basics are the candlesticks, patterns, trends etc. The tools I am referring to are called indicators and oscillators. Those fancy terms don’t really describe the tools that we use in a manner that is user-friendly so we can just call them, tools that assist with confirming our initial read of the market or particular equity.
There are a large number of tools that we can use and I could write endlessly about how they work and whether or not they are valuable but the reality is any tool is only as valuable as the ability of the person using it. So, having said that, I will go through a couple of the tools and then I will empower you to look further for whatever particular tool floats your boat. Let me say this upfront that each and every tool has its own strengths and weaknesses and that no one tool is perfect and there is no holy grail in technical analysis that makes trading foolproof. We can choose to make our trading simple or complicated, that is up to each individual to decide but remember that William of Ockham, the English philosopher, once said that “the simplest solution is probably the best.”
Here are a few of the indicators that we will look at, there are many more indicators than what we will discuss here but these are some of the more popular indicators that folks use. The list goes something like this, the moving averages, the MACD, Bollinger bands, RSI(Relative Strength Index), and ATR(Average True Range). As I said and you will discover that there are a bunch more indicators and some of them you may find more useful than these but these ones are widely used. We need to remember we do not trade on indicator signals alone. Smart trading only uses indicators as confirmation or indication that something is going as expected. We first determine our position from the price action and time frame that we are looking at and then we can bring in indicators to round out our thesis.
In today’s blog, we are going to go over the moving averages and how we use them and next week we will look at one of the oscillators we use and see what it means to us and our trade setups. There are basically two types of indicators, that would be oscillators and all others. Each type of indicator has a different function and through our study here we will come to understand how and when to use the information that each indicator gives us.
Let’s get started with the moving averages. There are two main types of moving averages, simple and exponential. First the simple moving average, this indicator essentially takes the price of an given equity and adds them all together and then divides that by the number of days in the time period to get an average price and then this price is plotted along a line and it gives us an indication of what the average price is doing over that time frame. The question that pops into one’s mind is why do we care? We care because this can give us an indication that the market or equity is possibly changing and it also gives us a level to watch to see if the overall trend might be changing. Traders and investors use moving average to help determine if something is bullish or bearish. For example, a lot of long term investors use the 200MA to determine whether a stock is bullish or bearish, if the moving average line is above the 200MA then longer term investors are typically bullish on the stock and if the price is below the 200MA then the investor may be bearish on that particular stock. Position traders and Swing traders use the MA in a similar manner, just typically shorter time frames like the 50MA for the position trader and the 10 and 20MA’s for the swing traders. The difference between a Swing trader and a Position Traders is just the length of time that they typically hold positions. A position trader might hold a position for months or years whereas a Swing traders might be days and weeks in a position as opposed to months and years.
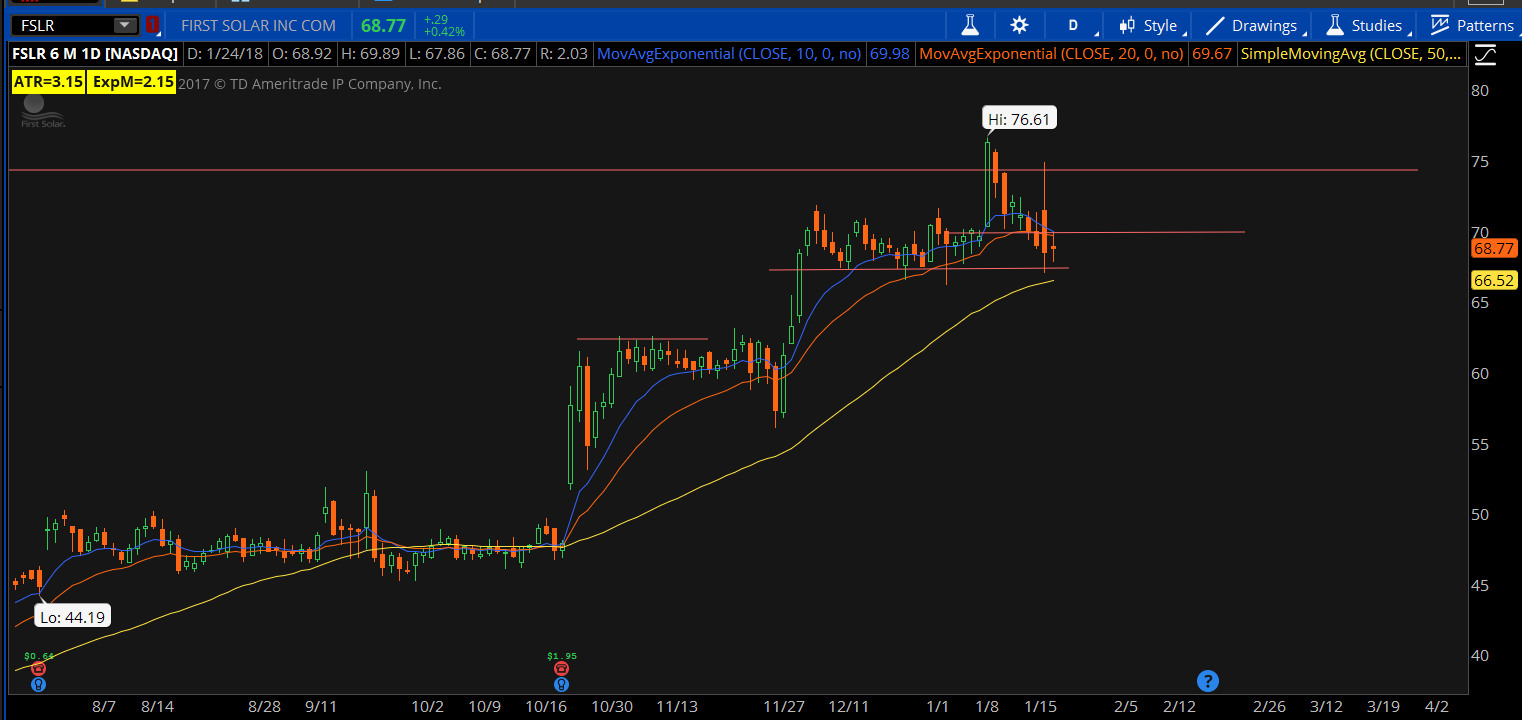
Take a look at the chart below, you can see the 50, 20 and 10MA lines on this chart. We can see that the lines have been running in the same direction for a while, indicating a trend, but that the blue line(10MA) is coming together with the red line(20MA) and that indicates that the shorter term trend could be changing. When the lines of the MA’s cross this is a clear indication of change and we can use this to help us confirm the price action that a trend change is in the works.
One thing to be aware of when using the moving averages is to understand that the longer the timeframe the more importance we can put to the information that it gives us because it takes longer to produce that data and that can tell us more about the longer term trend. The second moving average is the exponential moving average. The difference between the two is that the simple weights all the data equally whereas the exponential place more weight on the more recent data. One can use either one in the same manner but one will have to decide which is more appropriate for their trading, you have to ask, is the more recent data more important than the older data or should is all be weighted the same? That is up to the individual trader to decide.
So to recap, the key to using the moving averages is to watch to see if the trend is likely to continue as we saw with the three MA’s moving in sync with one another and then watching when the MA’s come together and crossover as an indication that the trend may be changing. If you are not already using the MA’s on your charts this is good practice to throw them on and use that information to confirm what you believe is happening in your stock. For example, you may be watching an intermediate uptrend and then you start to see some smaller candles and the volume is dropping off and from this price action you believe a reversal is imminent, then look at the MA’s to see if they are coming together and this can help confirm that your expectation may be correct.
Until next week, practice watching how the MA’s work and see if you can find that this indicator helps confirm your thoughts about a particular stock movement. Next week we are going to go over the MACD indicator. The Moving Average Convergence Divergence (MACD) indicator uses the moving averages in a different way to help us gauge the momentum of a particular equity, we will delve into this powerful indicator and increase our technical skills!
