

Tackle Trading Newsletter: 4.13.24
April 13, 2024

Tackle Triple Play
Topic #1 Earnings Kickoff
The start to this earnings season didn’t deliver the bullish surge the market was hoping for. However, the aggressive market sell-off wasn’t necessarily a reflection of the banks’ earnings results, but rather what seemed to be predestined by inevitable profit-taking actions that were bound to occur, regardless of the outcomes.

Consider JP Morgan (JPM) as a case in point. The bank beat with an EPS of $4.44, beating the $4.17 estimate, and posted revenue of $41.9 billion, topping expectations of $41.68 billion. However, from the moment their earnings were released, the market sold off aggressively despite the headline beats. Now, much of the financial media is focused on JPM’s net interest challenges. This is valid, given JPM did report a slight miss in net income influenced by the volatile interest rate environment and also announced a $1 billion hike in their expense forecast for 2024.
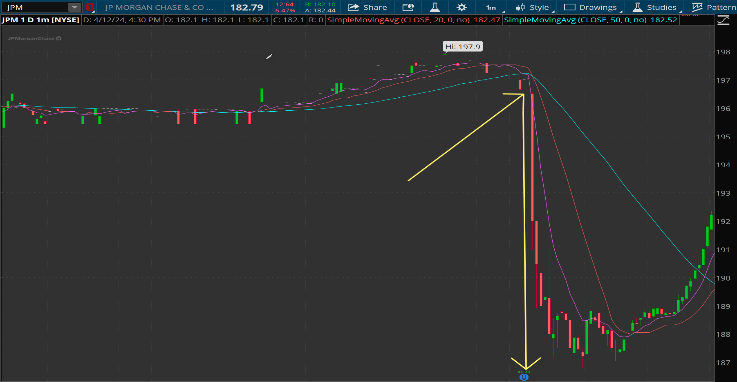
However, it seems the decision was made well before the market became aware of the net interest challenges—and let’s not forget, we are discussing earnings beats here. The market started dumping the moment the earnings report was released. In truth, Wall Street had likely made up its mind days, if not weeks, earlier. Be it concerns over renewed inflation, escalating geopolitical risks, surging yields, or the strengthening dollar, or something as simple as profit taking after long bull run, Wall Street might have been looking for any excuse (most likely a little of all) provided by the earnings season to unload shares… but sure, let’s talk more on the net interest issues.
Earnings Season Recap: 6% of the S&P 500 has reported.

- EPS BEATS: 83% (77% 5-year average)
- REV BEATS: 53% (69% 5-year average)
- BLENDED EPS: 0.9% (April 1 = 3.4%)
Despite the banking sector outperforming EPS expectations with a 12.5% beat this week, the overall blended growth rate for the S&P 500 has declined due to several factors. Key among these are the negative revisions in the Healthcare sector, primarily driven by companies like Bristol-Myers (BMY) facing downward adjustments in their EPS estimates. Additionally, minor revisions to guidance expectations in other market sectors, such as Energy, have also contributed to the tempered growth outlook. Despite the BMY revision, it is normal for the market to lower expectations in the two weeks prior to JPM and the other banks stating earning season.
As the market experiences a sell-off this week, nearing the 50-day simple moving average, all eyes turn to the upcoming earnings reports, which are set to expand with 41 S&P companies and 6 Dow components scheduled to release results. Following the traditional focus on banks in the earnings kickoff, next week keeps the spotlight on financial giants like BAC, GS, and MS. Additionally, attention shifts to the healthcare sector with anticipated reports from UNH, ABT, JNJ, and ISRG. On the growth front, ASML and NFLX are poised to offer insights, with NFLX known as a catalyst stock.

Topic #2 Volatility Vortex
In the world of trading, grasping the dynamics of market shifts is essential. After considering various explanations, I settled on a step-by-step approach to describe the phenomenon of shifting volatility and its role in signaling rapid market reversals at the top end of trends. Below is a step-by-step process to understand the “Volatility Vortex.”
1. Slowing Momentum in the Bullish Uptrend

Initially, the market shows a deceleration of momentum in its bullish trend. This slowing is the first sign that the consistent upward movement might be losing its steam. Traders should watch for reduced volume or less aggressive price highs as early indicators of change.
2. Violation of Patterns Within the Trend
The next phase involves a clear violation of established patterns, such as the break of short-term support levels. This breakdown is a critical warning that the market’s behavior is changing, indicating that the consistency of previous trends is diminishing.
3. The Volatility Vortex

Following the breakdown, the market enters the “Volatility Vortex.” During this phase, price movements become erratic swinging up and down with increased speed but without a clear direction. This heightened volatility reflects the market’s uncertainty, making it challenging for traders to predict the next move.
4. The Dam Breaks: Volatility Pours Out
The culmination of these phases is likened to a dam break. After building through earlier stages, volatility finally pours out, resulting in significant price movements as traders and investors rush to sell at the higher price.
Patience Is a Position: Waiting Out the Storm
As the market transitions, shifting volatility and the breakdown of support clearly mark the end of a trend, even for the most cautious traders. Adopting a stance of patience is crucial, but it’s more than just waiting out the storm—it’s also about spotting the next opportunity. As volatility subsides, much like the receding waters after a dam break, we gain clarity and begin to identify the next trend, positioning ourselves for strategic moves ahead.
Topic 3: Large Moats
In the constantly shifting landscape of the stock market, certain strategies rise to prominence during turbulent times. One such strategy that emerged in 2023 was the focus on “Big Moat Plays,” a term that came into sharper focus during and after the March 2023 “Flash Banking Crisis.”
March 2023: A Turning Point

The Flash Banking Crisis of March 2023 introduced a period of heightened volatility in the market. However, this instability set the stage for big-cap tech and other large moat companies to dominate market dynamics. The performance of average stocks, as measured by the RSP (the equal-weighted S&P 500 index) and IWM (small caps), stalled, but select big moat stocks like Apple witnessed significant growth during this period.

The New Safety Trade
The movement in big-cap tech stocks was so pronounced that it became a recurring joke on the Halftime Report that “big-cap tech was the new safety trade.” This wasn’t just a light-hearted comment but a real observation about where savvy investors were turning during times of strife and uncertainty.
Why Big Moat Stocks?
Investors tend to gravitate towards safety and quality during uncertain times, similar to a traditional rush towards bonds and gold amid geopolitical concern. Big moat companies, with their substantial competitive advantages and diversified business models, are seen as capable of weathering adverse conditions. This confidence was mirrored in the market performance immediately following the banking crisis and continues to be a key trend in the face of ongoing market uncertainties. Apple (AAPL) was a prime example during the 2023 banking crisis.

This week mirrored the 2023 sentiment with similar market behaviors resurfacing amidst hot inflation and geopolitical tensions. Notably, on a particularly challenging day in the market, Nvidia stood out with positive gains, and Apple ended the week on a strong note.

Big moat stocks, especially in the tech sector, are recognized for their significant competitive advantages. Although short-term market fluctuations can affect all sectors, these companies often demonstrate enhanced resilience. Their robustness during periods of uncertainty is noteworthy, and they frequently show potential for growth. As we move forward, understanding the dynamics of big moat stocks can be beneficial for those observing market trends and strategic opportunities as the weekly heat map indicates.

Sector Rankings

This week, all sectors within the S&P 500 experienced downturns, signaling that current market conditions are impacting the board broadly, rather than being confined to sector-specific issues. The S&P 500 Index itself was down by 1.56%.
- Financials: Led the decline with a significant drop of 3.58%, a clear indication of investor reactions to disappointing earnings.
- Technology: Held up better than others, decreasing only by 0.45%, potentially due to the resilience provided by large cap tech companies and their sizable MOATS.
- Materials: The sector fell 3.07%, and traders are closely watching the $90 mark, as it’s considered a key level of support based on the 9 weekly EMA.
- Energy: Saw a decrease of 1.98%, affected by factors beyond typical market fluctuations, including geopolitical tension in the Middle East.
As we proceed into the weeks ahead, with healthcare reporting soon and growth sectors the following week, the market dialogue may shift to be more sector focused.
Market Indicators
RSI: It’s remarkable what a couple of weeks of consolidation and a downward drift to the 50-day SMA will do to alleviate concerns about overvaluation. While the weekly chart still resides in overvalued territory, the daily RSI has now dipped into bearish territory below 50. A bullish signal would emerge with a positive slope above 50.

VIX: Despite the VIX still not accurately pricing in the risk earlier in the week, it did experience a significant uptick during the early morning hours on Friday. However, as the market began to stabilize, the VIX relinquished more gains than expected during the consolidation phase, considering the initial spike on Friday morning.

Fear Guage: Over the last two weeks, we’ve observed a notable shift in market sentiment, with the fear gauge moving from extreme greed levels to a more neutral position. This adjustment appears to be a response to market concerns about potential rate cuts, inflationary pressures, and spikes in volatility.

Moving Averages: At Tackle Trading, we often use moving averages as anchors for several reasons, especially in current market conditions. Two key considerations are: a. Moving averages frequently serve as support catalysts, bolstering price levels during periods of market uncertainty. b. Should support levels break; it could signal potential entry points into a moving average pocket that might amplify market correction analysis.

The market is sitting on the 50 daily SMA aligning closely with the 9 EMA on the weekly chart. This convergence played a pivotal role in decelerating the market sell-off as Friday’s price action unfolded. It sets the stage for a compelling technical showdown with volatility anticipated to take center stage early next week.
Gaslight-nomics: Economic Landscape
Inflation dominated the conversations from Monday through Friday this week. Trading activity was notably subdued on Monday and Tuesday, with a humorous twist emerging in the media attributing the light trading to the eclipse. Occasionally, financial media reaches for tenuous explanations for market movements.
The real reason for the lighter trading at the start of the week was the anticipation of the Consumer Price Index (CPI) report on Wednesday. With January and February’s inflation figures coming in hot, all eyes were on March’s data, which remained a central concern. True to form, March’s inflation figures also escalated.

The inflation report left little room for ambiguity, as it was universally strong. The headline CPI exceeded expectations, rising by 0.4% and elevating the annual rate to 3.5%. The core CPI also surpassed forecasts, marking a 3.8% year-over-year increase. Even more striking was the SuperCore CPI, excluding shelter, which surged by 0.7% month-over-month, reaching an annual rate of 5.0%. As a result, both the dollar and market yields saw significant increases on Wednesday following the release of these figures.
In recent weeks, we have been emphasizing the significance of yields and the dollar against a backdrop of persistent inflation, which continues to lay the groundwork for potential surges that could dramatically impact these charts. At the very least, the rising trajectories of these charts serve as an anchor on the market. Moreover, should they ascend too steeply, as observed last year, they have the potential to exert considerable pressure on the markets.
There was even more anticipation for the PPI on Thursday following the hot. CPI data on Wednesday. While the headline numbers where slightly softer than headline expectations (0.2 MoM vs 0.3 MoM exp; YoY PPI 2.1% vs 2.2% exp) the YoY number still rose from 1.6% is the highest reading in nearly a year. Core PPY was hotter than expected at 2.4% versus 2.3%.

So hotter inflationary data than the month before slightly less than expected. It appears that the only reason why it did not come in hotter than expected on Thursday was falling gas prices which fell by 3.6% in the report. Did you pay lower gas prices last month? You did not? Neither did anyone else but somehow magically due to “seasonal adjusted factors” which prevented the producer report from being red hot as opposed to just hot.
The dollar and yields certainly saw through the mirage of the PPI report on Thursday and rate cut odds for June are now significantly lower than they were at the start of the week. To start the week, it was about a 50-50 coin flip and now shifting significantly to no cut.

Fed speak following the inflationary data was very measured. No “everything is awesome” and no “we are going to have to hike.” There were not many clues into their thinking. Powell has been incredibly dovish over the last couple months, and it will be interesting to see if we see more of that type of tone and dialogue on Tuesday which markets would certainly celebrate.
The Coming Week
We have a very light economic calendar heading into the first week of earnings which will likely dominate the headlines. All due apologies to retail sales and unemployment claims the highlight of the week is likely Jerome Powell on Tuesday where he will be participating in a moderated discussion with Tiff Macklem, Governor of the Bank of Canada in D.C.

Global Markets:
Gold: From a macro long-term perspective, gold appears to be signaling significant upcoming shifts. This anticipation could be rooted in several factors:
- Double Dip Inflation: Concerns about inflation resurfacing after a temporary lull.
- Stagnation: Fears of economic stagnation amidst recovery efforts.
- Debt Crisis: Potential crises stemming from high levels of national and international debt.
- Geo-Political Activity: Uncertainties due to increasing geopolitical tensions.
- Safety Trade: Gold’s traditional role as a safe haven during times of market volatility.
- Central Banks Activity: Indications that central banks are increasing their gold reserves.
These issues have been discussed in detail on the Trading Justice podcast. Given this context, the rationale for owning gold is stronger than ever. As we start the week, a pivotal question arises: will the short-term market volatility seen last Friday persist into the new week? Such fluctuations have historically influenced gold prices. While short-term technicals will be analyzed for tactical trading, any dip in gold prices is likely to see considerable buying interest.

Oil: Geo-political tensions, particularly involving Iran, are escalating and are expected to persist, leading to numerous headlines that could influence oil prices. The daily chart for oil has shown a pattern of sharp rises followed by periods of uneven consolidation, yet oil remains one of the best performing assets of 2024. Although energy stocks may experience some volatility if the broader market does, the robust economic data and supportive actions from OPEC suggest that any dips in energy and oil stocks are likely to attract buyers.

Bitcoin: Currently, Bitcoin is primarily driven by range mechanics. The price is approximately where it was a month ago, having established a trading range in that time. In such scenarios, especially for those who are not cash flow traders—given the limited options with Bitcoin—range mechanics typically lead to either a breakout or deeper pullbacks that create opportunities for new entries. Following significant price surges, it’s common for Bitcoin to enter these ranges, as it is now, while the market anticipates the next major movement. In this context, patience is key.

Rapid Fire: Coaches Favorite Picks
Legal Disclaimer
Tackle Trading LLC (“Tackle Trading”) is providing this website and any related materials, including newsletters, blog posts, videos, social media postings and any other communications (collectively, the “Materials”) on an “as-is” basis. This means that although Tackle Trading strives to make the information accurate, thorough and current, neither Tackle Trading nor the author(s) of the Materials or the moderators guarantee or warrant the Materials or accept liability for any damage, loss or expense arising from the use of the Materials, whether based in tort, contract, or otherwise. Tackle Trading is providing the Materials for educational purposes only. We are not providing legal, accounting, or financial advisory services, and this is not a solicitation or recommendation to buy or sell any stocks, options, or other financial instruments or investments. Examples that address specific assets, stocks, options or other financial instrument transactions are for illustrative purposes only and are not intended to represent specific trades or transactions that we have conducted. In fact, for the purpose of illustration, we may use examples that are different from or contrary to transactions we have conducted or positions we hold. Furthermore, this website and any information or training herein are not intended as a solicitation for any future relationship, business or otherwise, between the users and the moderators. No express or implied warranties are being made with respect to these services and products. By using the Materials, each user agrees to indemnify and hold Tackle Trading harmless from all losses, expenses, and costs, including reasonable attorneys’ fees, arising out of or resulting from user’s use of the Materials. In no event shall Tackle Trading or the author(s) or moderators be liable for any direct, special, consequential or incidental damages arising out of or related to the Materials. If this limitation on damages is not enforceable in some states, the total amount of Tackle Trading’s liability to the user or others shall not exceed the amount paid by the user for such Materials.
All investing and trading in the securities market involve a high degree of risk. Any decisions to place trades in the financial markets, including trading in stocks, options or other financial instruments, is a personal decision that should only be made after conducting thorough independent research, including a personal risk and financial assessment, and prior consultation with the user’s investment, legal, tax, and accounting advisors, to determine whether such trading or investment is appropriate for that user.
